Why You Should Review Facebook Insights
 Do you ever feel as if you are flying blind on Facebook? Lots of marketers do. They realize that the world’s most popular social network gives them a great way to reach out to customers, fans, and prospects, but aren’t sure how to measure the progress they are (or aren’t) making.
A good first step to solving this quandary is logging into Facebook Insights. It’s an analytics tool that’s provided for every Facebook business page you create, and can be accessed by anyone who has been designated as an admin for the page. Let’s see how you can use it to optimize your social campaigns and get more from every post…
Finding Facebook Insights
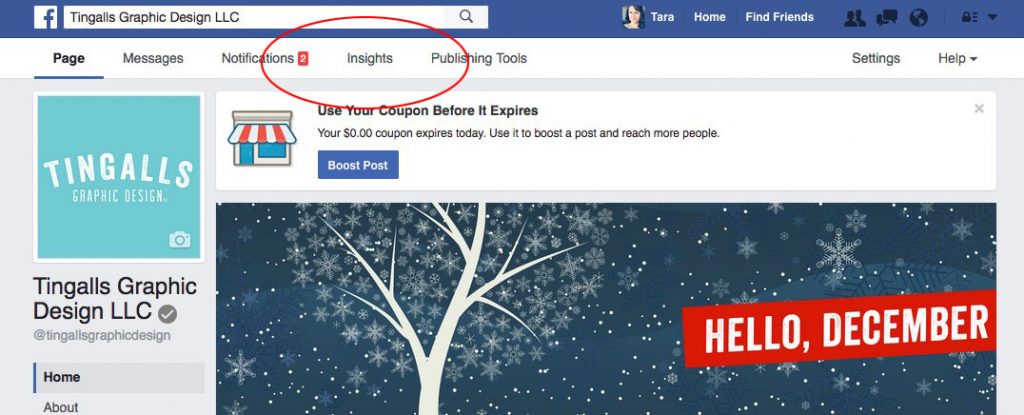
You may not have even noticed your Facebook Insights option before. To find it, navigate to your business page. From there, click on the option that says ‘More,’ and locate ‘View Insights’ in the drop down menu. Click on that, and you’ll be taken to your dashboard.
What to Look For in Facebook Insights
Once you open your analytics page, you’ll be confronted with a handful of readily-made reports and statistics, along with a listing of your most recent posts. This space essentially serves as your dashboard, and the same way you would see key stats when you log into Google Analytics.
The great thing about Facebook systems is that most of the information you’re looking for will be presented automatically, and in an easy-to-understand format. Still, there are a few things you should definitely pay close attention to.
First, to the right of “Page Summary” you’ll want to choose the timeframe of data you want to review. You can choose from Today, Yesterday, Last 7 Days or Last 28 Days. We typically review our posts monthly so we choose “Last 28 Days”.
Then, from the left hand menu bar, here’s what you want to keep an eye on:
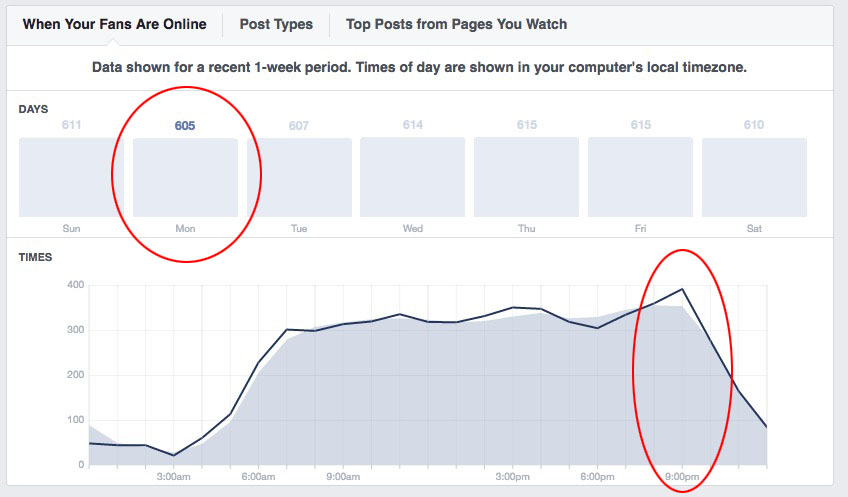
Posts > When Your Fans Are Online
Use this report to figure out when you have the most fans online to havethe best chance of them seeing your content. In some industries, you might notice that your fans are more often online on the weekends than during the week. Roll over each day of hte week to see how your fan interaction fluctuates. Looking at Tingalls insights for the 1st week in December, you’ll see that our fans were most engaged on Monday between 7-9:00 PM.
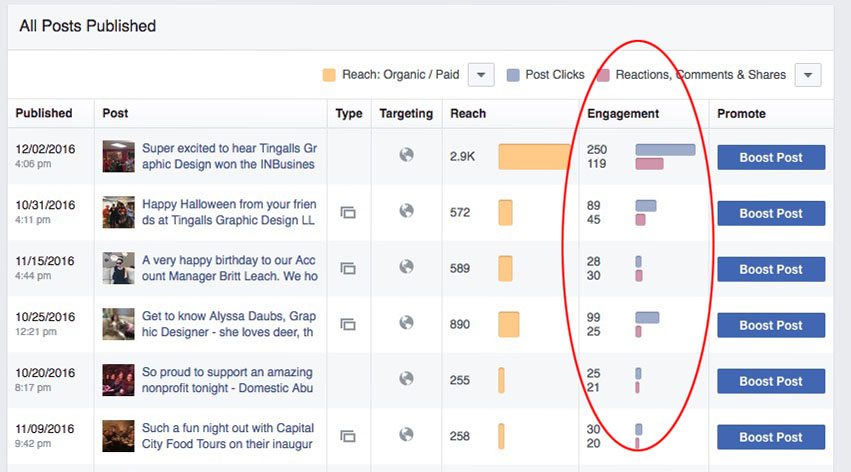
Posts > Post Types
Click on the tab next to Fans to see which post types get the most engagement. We all know video pretty much takes the cake, but you might also see a particular photo or blog posts that got a lot of action here. This section is sortable by clicking on the black column headers.
Likes
Are you working on a campaign to build fans? You can quickly view whether the campaigns are working by changing the date and monitoring how many fans rose between a certain period of time. This page will also show you “unlikes” as well as what content you posted that day and how it might have contributed to new fans.
Reach
Not everything you post to your business page is going to be seen by all of your fans and followers. In fact, Facebook uses a relatively complex engagement formula to determine how often your messages show up. By evaluating your reach, you can get a sense of whether you’re making a strong impression on fans and followers or not.
Page Views
Are you working hard to get exposure to your Facebook page from an outside source? You’ll be able to track this progress using the “Page Views” tab. You’ll notice below, once we posted Tingalls Holiday Desk Decorating Competition asking our fans to vote, our exposure skyrocketed from an average of only a handful of views per day to over 100!
People
Learn more details about your fans in the “People” tab. Gender, age, where they live, etc. This data is especially important as you consider your target market in social media campaigns.
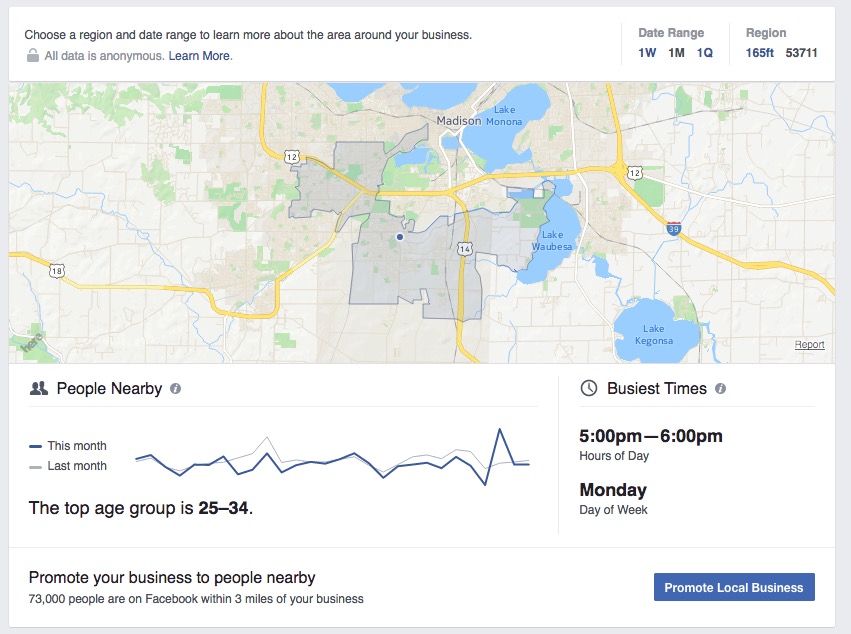
Local
Thinking about boosting your posts? Check out the data in this tab to set your ideal target market, their location and other important data. Keep in mind, if you’re a service based industry like a spa or hair salon, people won’t travel more than 10-20 miles so keep the mile radius small.
We recently met with a client who decided to give “boosting” a chance. She paid $50 per day for 14 days and her website traffic increased from roughly 300 hits per month to over 8,000 that month which translated into quite a bit of new business for her. Not too shabby!
Putting it All Together
While each of these reports or indicators gives you a small snapshot of what’s going on with your Facebook business page, you can put them together to figure out a lot of things, such as:
- Am I posting as often as I should be?
- Are my fans and followers seeing my content and responding to it?
- Should I try posting at different times/days to get more viewership?
- Which topics are attracting the most interest?
…and so on. By looking at the available data and asking these kinds of questions, you can go a long way towards building a profitable and effective campaign. Given that the analytics you need are free, and easy to find and use, why wouldn’t you make the most of them?
Let us know if we can help you sort through the clutter or if you’d like to review the above in person. We’d love to help!
Related Posts